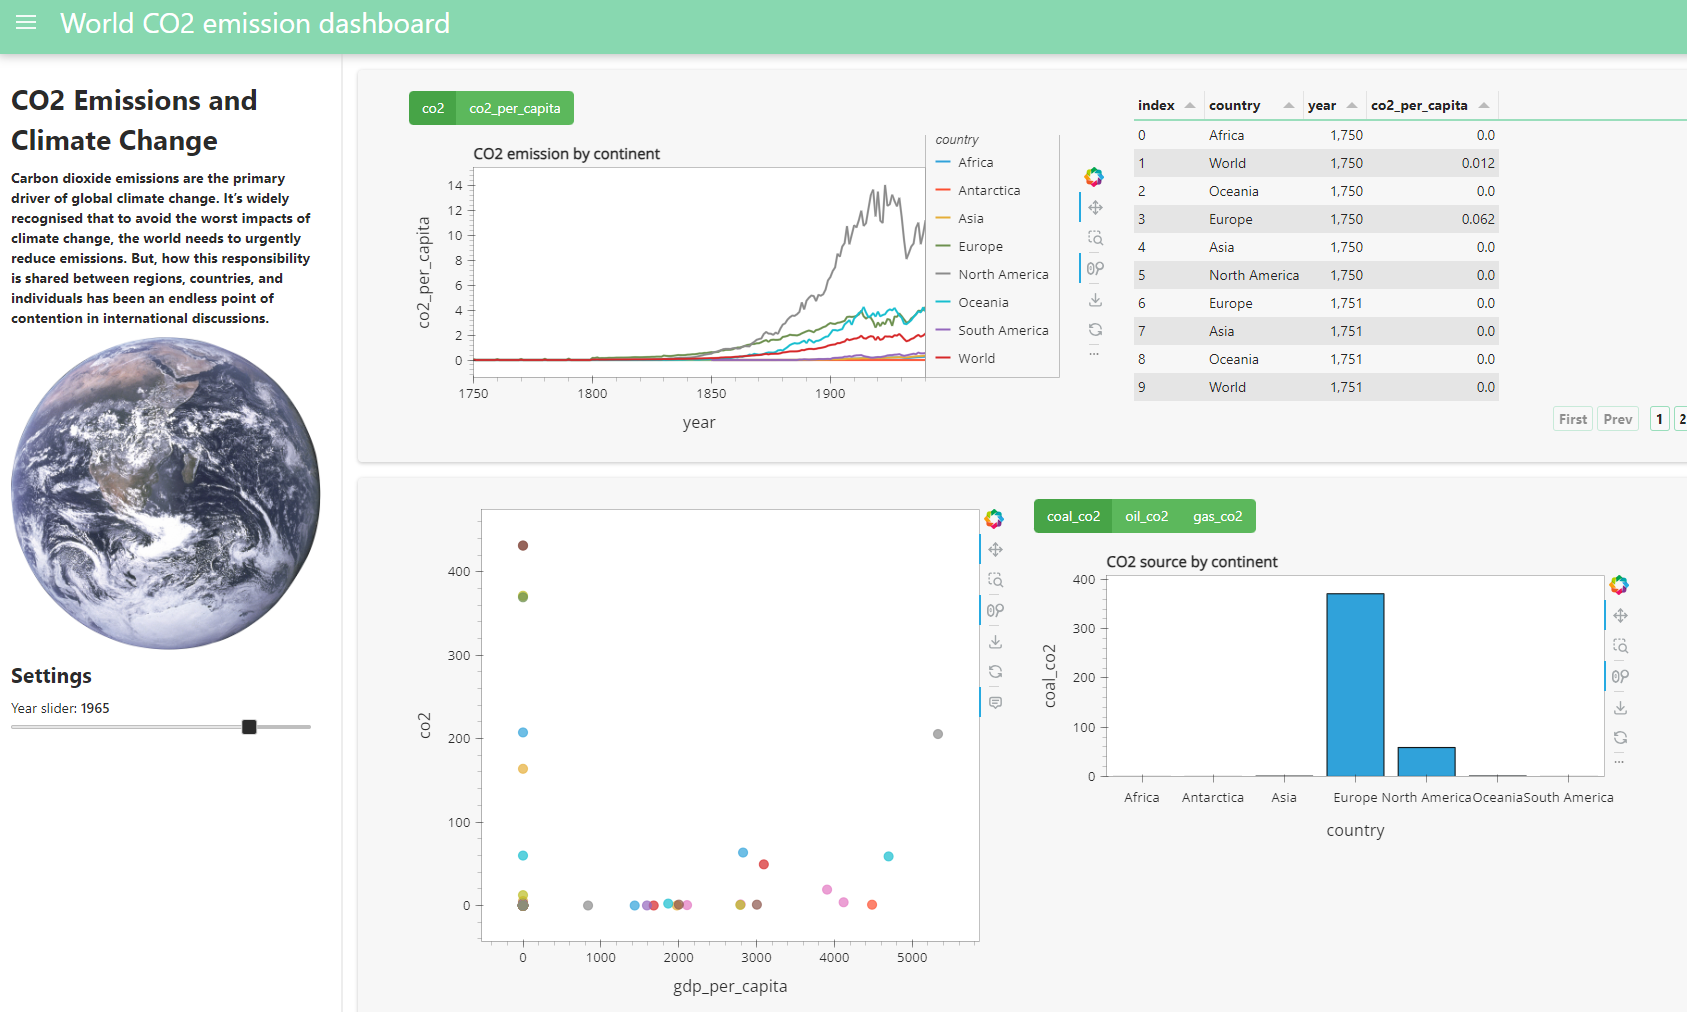
World CO2 emission dashboard
Project focused on analyzing worldwide CO2 emissions using tools like Python and Panel to generate dynamic dashboards. These dashboards enable users to explore trends, patterns, and correlations within CO2 emissions data effectively, facilitating informed decision-making and environmental policy formulation.
Python - Streamlit - Plotly
Enhanced Python Interactive Dashboard Development for sales analysis, harnessing the capabilities of Streamlit and Plotly to craft dynamic visualizations comparable to those in PowerBI and Tableau. This project utilizes cutting-edge tools such as Streamlit and Plotly, tailored specifically for analyzing sales data pertaining to the Adidas company.
Finance Marketing
Enhanced Python Interactive Dashboard Development for Bank Marketing Analysis, leveraging the powerful capabilities of Streamlit tools to provide intuitive data exploration and actionable insights.